Table of Contents
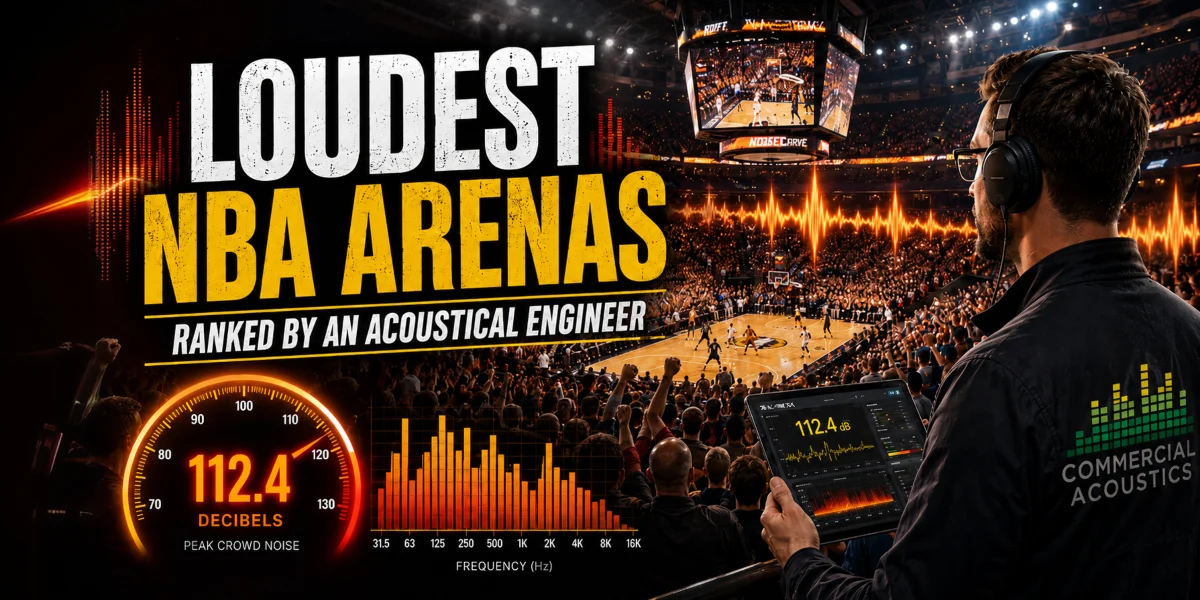
How We Ranked the Loudest NBA Arenas
Crowd noise in an NBA arena is not just fan enthusiasm. It is a measurable acoustic event shaped by ceiling geometry, wall materials, bowl rake, and how the roof reflects energy back onto the court. After two decades specifying sound systems and acoustic treatment for venues, we have opinions about which arenas earn the “loudest” label and which just have a good marketing department.
There is no league-wide standard for measuring arena noise. Teams cite phone-app readings, jumbotron meters, and Guinness one-offs interchangeably, and the methodology behind each is rarely disclosed. So we built an editorial index instead of pretending one exists.
- 40 PTSArchitectural Acoustics: cubic volume per seat, ceiling height and shape, wall and floor finishes, bowl rake.
- 30 PTSSustained Crowd Baseline: attendance %, third-quarter energy, opponent FT differential.
- 20 PTSPeak Event Noise: any published or credibly observed dB peaks during playoff or rivalry games.
- 10 PTSOperational Design: dedicated loud sections, hype crews, jumbotron dB games, in-bowl PA shaping.
The result is the CA (Commercial Acoustics) Loudness Index, a 0-to-100 score you should read as informed opinion, not a calibrated SPL (Sound Pressure Level) measurement. A side metric, Per 1k Seat, lets small-market arenas show what their crowd produces per seat — so a tight bowl with rabid fans is not unfairly dinged for having fewer chairs. For context on what individual decibel levels actually mean at the ear, our dB chart for occupied spaces covers the full range from quiet office to threshold of pain.
All 30 NBA Arenas, Ranked by Loudness


This index is informed editorial, not metrology. No calibrated league dataset exists to rank against. The only Guinness-grade peaks on record are Sacramento’s 126 dBA and the pre-2018 Bucks at 106.6 dBA — everything else is extrapolated from phone-app readings or marketing claims.
Top Ten Loudest NBA Arenas, Broken Down
 #1 Sacramento Kings | Golden 1 Center
On November 15, 2013, 17,317 Sleep Train Arena fans hit 126.0 dBA during a Pistons stoppage with a Guinness official on site and calibrated gear in hand. Golden 1 Center inherited the tight bowl geometry in 2016, and the team’s reported 112 percent average attendance keeps the noise floor up every night.
 #2 Oklahoma City Thunder | Paycom Center
Paycom Center has one of the smallest cubic volumes in the league, which is exactly why it gets loud. Tight bowl, low ceiling, sellouts every night, plus a jumbotron dB meter that trains the crowd to chase 110 to 115 dBA on third-quarter runs. On the Per 1k Seat metric, Paycom ranks behind only Sacramento across the entire league — the cleanest signal that small market does not mean small noise.
 #3 Boston Celtics | TD Garden
The Boston Globe measured 110 dBA in TD Garden’s lower bowl during the 2024 playoffs, where the Celtics went 10-0 at home. JJ Redick called it the loudest place his team had played — the balcony overhang does most of the work, reducing the cubic volume the sound has to fill.
 #4 Indiana Pacers | Gainbridge Fieldhouse
Gainbridge spent years labeled as a polite Midwestern barn until the 2025 Finals run rewrote the reputation. Steep upper rake, exposed steel structure, glass curtain wall, and Games 6 and 7 against Oklahoma City showed a reverb time long enough to keep crowd peaks audible into the next play.
 #5 New York Knicks | Madison Square Garden
Charles Luckman designed Madison Square Garden’s concave cable-tension ceiling to clear the rail hub directly below — 48 steel cables, no internal supports. The low uninterrupted roof traps sound near the floor instead of letting it dissipate upward; the perforated metal has absorptive backing, but what does come back, comes back fast.
 #6 Memphis Grizzlies | FedExForum
FedExForum is small, hard, and dense — brick and exposed-finish surfaces inside the bowl borrowed from Beale Street aesthetics but acoustically treated as reflectors. The Grit-and-Grind era trained a sustained noise baseline that still shows up most nights, with a reverb tail longer than modern absorptive builds.
 #7 Utah Jazz | Delta Center
Delta Center has one of the steepest upper bowls in the league. Steeper rake means more fans closer to the geometric center, lower cubic volume per seat, and a shorter path back to the floor. The 1991 build predates the modern absorption code era, so the inner shell stays reflective.
 #8 Milwaukee Bucks | Fiserv Forum
The Bucks held the Guinness world record at 106.6 dBA at the old Bradley Center on December 20, 2008, before Sacramento took it in 2013. Fiserv Forum (2018) has more absorption, taller cubic volume, and a softer reverb tail — peaks feel sharper but die faster.
 #9 LA Clippers | Intuit Dome
Intuit Dome is the most engineered fan-noise environment in the league. The Wall uses 4,500 seats across 51 uninterrupted rows; rafter-mounted dB meters alert staff when the noise drops. Clippers opponents shot 74.8 percent from the free-throw line in 2024-25, the second-lowest opponent FT rate in the NBA.
 #10 Portland Trail Blazers | Moda Center
Moda Center’s arched roof reflects sound back onto the floor instead of letting it escape into the rafters, the underrated story behind Rip City’s baseline. The 1995 build landed on the reflective side of the absorption-code era boundary — good for crowd noise, bad for visiting coaches.
The 2026 NBA Loudness Awards
Runner-Up
vs Detroit, Nov 15, 2013
Leader in the East
Sacramento technically owns the CA Loudness Index #1 AND the Per 1k Seat top spot — we spread the silver and bronze to OKC and Indiana to give the podium three distinct teams and three distinct stories. The table above shows Sacramento’s sweep on the raw numbers (red-highlighted 5.45 chip).
The 2026 NBA Sadness Awards
in 2024-25

Champion
Per Occupied Chair
Washington owns BOTH the lowest Loudness Index AND the lowest Per 1k Seat — we spread the silver and bronze to give the podium three distinct teams. LA Lakers’ 2.84 per 1k is the runner-up, and the Clippers got Hardest to Fill for the league’s biggest verified 2024-25 attendance drop (-12.6% moving into the new Intuit Dome).
Why Some Buildings Get Loud and Others Do Not
Put the same 18,000 fans in two different arenas and you can get wildly different decibel readings. The crowd is only the source. The building decides what happens to the sound after it leaves their mouths. Four design factors do most of the work.
1. Roof Height and Shape: Why MSG Traps Sound
Roof height and shape come first. A low, angled roof acts like a lid, reflecting sound back down onto the seating bowl instead of letting it dissipate into open volume above. Madison Square Garden’s concave cable-tension ceiling is the textbook case — only 48 feet above the floor at the apex and shaped to push energy back at the bowl. Tall, open arenas give the noise somewhere to go, so it fades faster.
2. Surface Materials: Oracle’s Concrete-Drum Effect
Surface materials come next. Concrete, steel, and glass reflect almost everything that hits them. The old Oracle Arena was the platonic ideal — a 1966 poured-concrete bowl with virtually zero absorptive treatment. The Warriors’ coaches publicly complained about the noise during the 2015 playoffs. The more reflective the box, the longer the energy survives.
3. Air Volume per Seat: What Oklahoma City Proves
Then there is air volume per seat. Oklahoma City proves the point. As one of the smallest buildings in the league at 18,203 seats stuffed into a tight bowl, Paycom Center packs the crowd into less air than almost any other arena. Each fan’s contribution stacks up faster against less volume to fill. You can estimate how a room’s volume and surfaces drive its decay using a room acoustics calculator.
4. Reverberation Time (RT60): Sacramento’s Lingering Roar
The fourth factor is reverberation time, the number an acoustician actually designs around. A long RT60 means sound lingers and layers on top of itself, building the wall of noise that let Sacramento’s crowd hit 126 dBA at the old Sleep Train Arena. A short RT60 means each cheer dies quickly and the room feels flat. Most modern arenas land between 1.4 and 2.2 seconds at mid frequencies — the upper end gets you a roar, the lower end gets you a clear PA.
The Designer’s Real Problem: Roar Versus Clarity
Here is the tension no fan thinks about. Everything that makes a crowd sound enormous also makes the public address system unintelligible. A long reverberation time smears speech into mush, so the announcer, the refs, and the emergency PA all suffer in the exact conditions that produce the best atmosphere.
Modern arenas solve it with a split strategy. Absorptive material goes on the upper ceiling to kill the runaway reverberation, while reflective acoustic ceiling clouds hang lower to bounce crowd energy back down and keep the room alive. It is a deliberate balancing act, not an accident.
The same physics scales down to any space where a crowd and a sound system share a hard-surfaced room. We work through that tradeoff with acoustic absorption panels for gyms, restaurants, and event halls — taming the reverberation without killing the energy that makes the room worth being in.
How Loud Is Too Loud at an NBA Game?
- 126 dBA: threshold of pain for many listeners, the Sacramento record.
- 120 dBA: safe exposure under 9 seconds, chainsaw or close-range siren territory.
- 110 dBA: safe exposure under 90 seconds, the TD Garden playoff baseline.
- 100 dBA: NIOSH safe exposure drops to about 15 minutes.
- 85 dBA: OSHA permissible exposure limit averaged over 8 hours.
NIOSH uses a 3 dB exchange rate, meaning every 3 dB doubles the sound energy and halves the safe exposure time. A peak crowd roar of 126 dBA delivers roughly 8,000 times the acoustic energy of an 85 dBA office. The roar lasts seconds, not hours, but the peak is real.
For courtside seats and floor staff, cumulative exposure is non-trivial. NBA referees and floor crews who do not wear hearing protection across a full season sit in the same risk category as factory workers without PPE. The league does not publish a hearing-conservation program for officials, but it probably should.
What Arena Design Teaches Office and Venue Acoustics
The same physics that makes Sleep Train Arena hit 126 dBA makes a hard-finished restaurant unbearable at conversation volume. Reflective walls, low ceilings, no absorption. The bowl-of-soup effect scales down to any room you have ever shouted in.
For commercial spaces where the goal is the opposite, speech clarity, lower noise floor, sustainable acoustic comfort, the design moves are the inverse of an NBA bowl. Add absorption at the reflective surfaces, break up parallel walls, control reverberation. Our acoustic absorption panels address the surface-finish side of that equation directly.
HVAC noise floor matters too. A target NC rating that is too low leaves the room exposed to every footfall and HVAC ramp. A target that is too high masks speech privacy. The NC rating chart for occupied spaces covers the right targets by room type.
Conclusion: The Real Engine Behind a Loud Arena
Crowd volume is a fan-energy story everyone wants to tell, but the room writes half the script. A tight bowl, a low ceiling, the right balance of reflective and absorptive surfaces. Those choices decide whether 17,000 yelling people sound like a deafening wall or a polite hum.
Sacramento still holds the record, but the design moves that made Sleep Train Arena loud are the same moves we ask architects to avoid in every restaurant, classroom, and open office we treat. If you want to know how an acoustical engineering team thinks about rooms like these, the people behind this work have spent the last 17 years doing exactly that.
FAQs: Loudest NBA Arenas
What is the loudest NBA arena ever recorded?
Sacramento Kings fans set the Guinness World Record at 126.0 dBA on November 15, 2013, during a game against the Detroit Pistons at the old Sleep Train Arena. A Guinness official verified the reading with calibrated equipment on-site.
Why is Madison Square Garden so loud despite being older?
MSG has a unique concave cable-tension ceiling designed by Charles Luckman to clear the rail hub below. The low, uninterrupted ceiling traps sound near the floor instead of letting it dissipate upward, concentrating crowd noise on the bowl.
How loud is too loud for a fan in the stands?
NIOSH considers 110 dBA safe for under 90 seconds and 120 dBA safe for under 9 seconds. A typical playoff roar of 110 to 115 dBA is harmless in short bursts but can cumulatively damage hearing across a full game.
What makes one arena louder than another acoustically?
Cubic volume, ceiling height and shape, wall and floor finishes, bowl rake, and reverberation time. Smaller, tighter bowls with hard reflective surfaces and low ceilings produce higher peak sound pressure than larger, softer modern arenas.
Does crowd noise really affect free-throw shooting?
League data supports it. In their first season at the Intuit Dome, Clippers opponents shot 74.8 percent from the free-throw line, the second-lowest opponent rate in the NBA. Sustained crowd pressure is a measurable home-court variable.
Sources & Data Notes
Capacity and year-opened figures are pulled from the official NBA arenas list on Wikipedia, cross-checked against team and venue sites for current sponsor names. Two arenas were renamed for the 2025-26 season: Wells Fargo Center is now Xfinity Mobile Arena (Philadelphia), and Footprint Center is now Mortgage Matchup Center (Phoenix).
- Sacramento Kings 126.0 dBA record: NBA.com, verified by Guinness World Records, November 15, 2013.
- Milwaukee Bucks 106.6 dBA previous record: Guinness, Bradley Center, December 20, 2008.
- Oracle Arena historical readings: KHOU-11 phone-meter readings, 2015 Western Conference Finals (treated as directional, not calibrated).
- TD Garden 110 dBA playoff baseline: Boston Globe field measurement, 2024 NBA Playoffs.
- Intuit Dome operations + opponent FT data: ESPN reporting on The Wall, 2024-25 season.
- MSG ceiling structure: Charles Luckman architectural records and historical building documentation.
- OSHA / NIOSH exposure limits: 29 CFR 1910.95 and NIOSH Publication 98-126 (3 dB exchange rate).
The CA Loudness Index is editorial. It synthesizes architectural acoustics, sustained crowd baseline, and what little verified peak data exists into a single 0-to-100 score. No league-wide calibrated SPL dataset exists; any ranking that claims one is extrapolating.

Walker Peek|Founder & CEO, Commercial Acoustics
Walker founded Commercial Acoustics in 2013 to bring aerospace-grade engineering discipline to soundproofing, and runs the firm as CEO from its 12,000 sq ft Tampa production facility. The company designs custom acoustic panels, sound membranes, and masking systems for multi-family, hospitality, healthcare, and commercial projects across the US — built around Walker’s invention, Wall Blokker, an EVA-based sound barrier that hits STC 50-plus at roughly $1 per square foot installed.
A Jacksonville native, Walker spent five years at Kennedy Space Center with Craig Technologies before founding Commercial Acoustics — certifying aerospace manufacturing to the AS9100 standard and leading Six Sigma Black Belt process-improvement teams on NASA programs. He is a certified Industrial Noise Control Engineer and the author of Architectural Acoustics: A Practical Handbook.