Table of Contents
Why Acoustics Splits Sound Into Bands
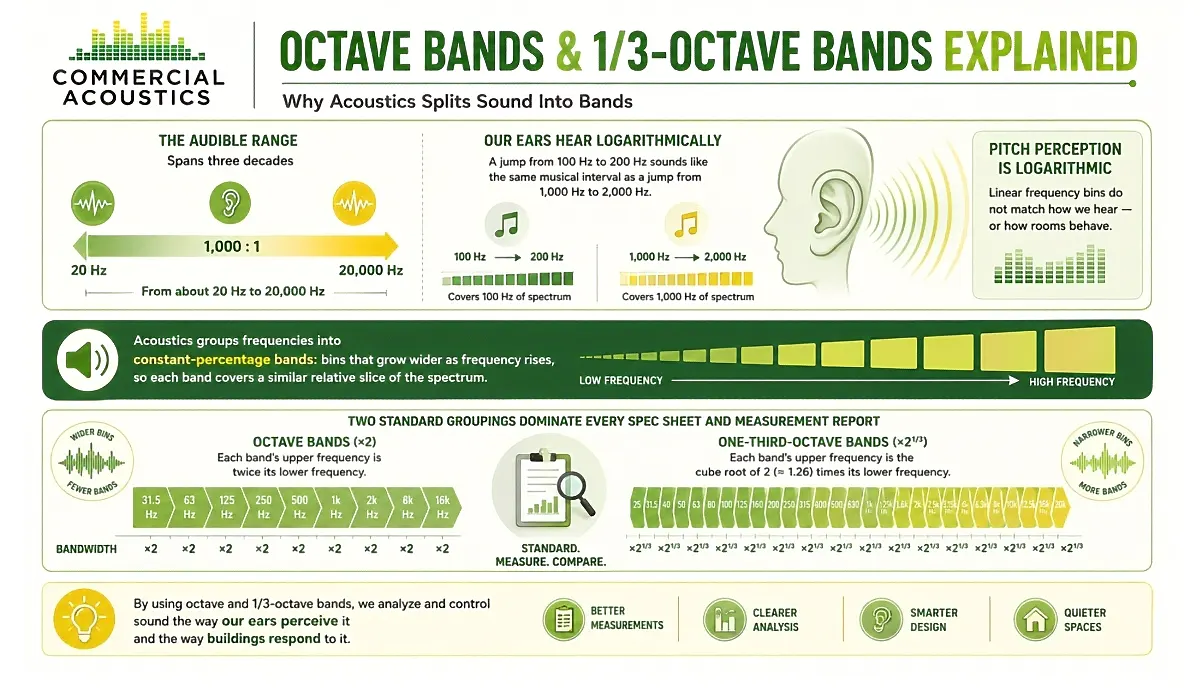
The audible range spans three decades — from about 20 Hz to 20,000 Hz. That is a 1,000:1 ratio, and our ears do not perceive it linearly. A jump from 100 Hz to 200 Hz sounds like the same musical interval as a jump from 1,000 Hz to 2,000 Hz, even though one covers 100 Hz of spectrum and the other covers 1,000. Pitch perception is logarithmic.
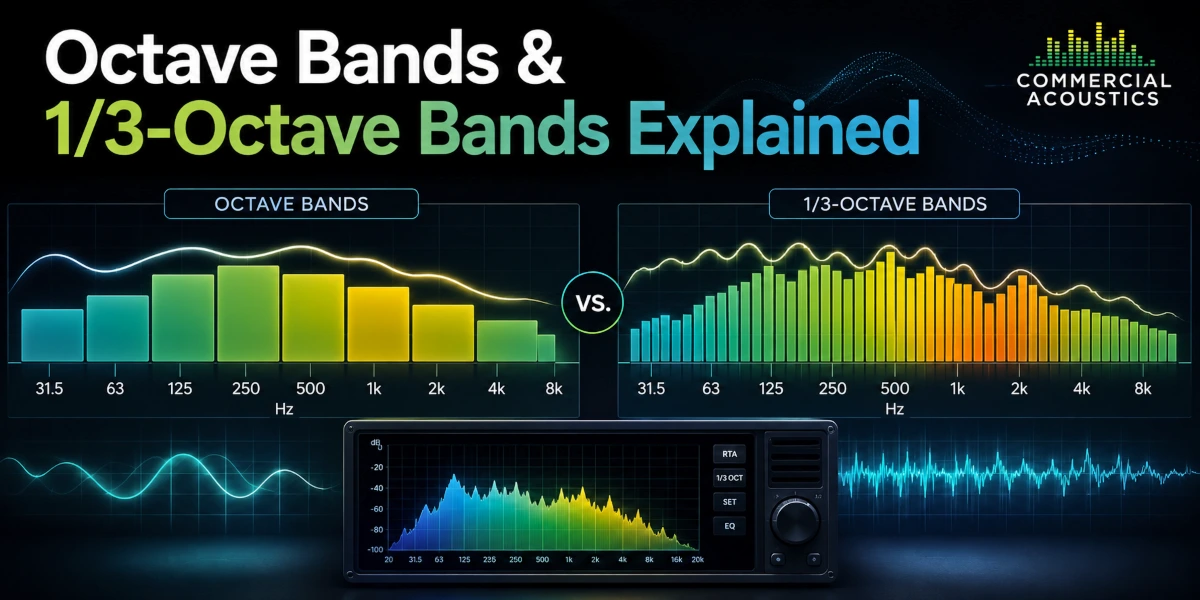
Linear frequency bins do not match how we hear — or how rooms behave. So acoustics groups frequencies into constant-percentage bands: bins that grow wider as frequency rises, so each band covers a similar relative slice of the spectrum. Two standard groupings dominate every spec sheet and measurement report in the field: octave bands and one-third-octave bands.
For background on the underlying unit, see our Decibels Explained primer. This post covers the next layer up: how the decibel readings get grouped into the bands the rest of the field is built on.
What Is an Octave Band?
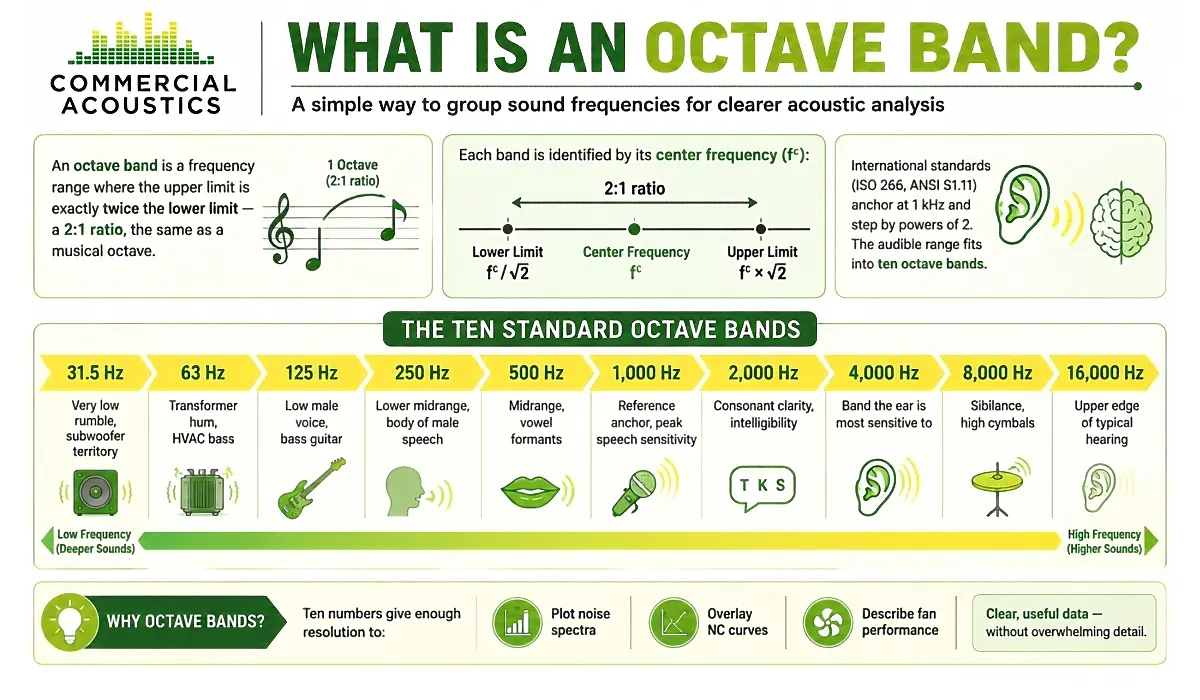
An octave band is a frequency range where the upper limit is exactly twice the lower limit — the same 2:1 ratio musicians call an octave. Each band is identified by its center frequency, with the band edges at fc/√2 and fc·√2.
The international standard set (ISO 266, ANSI S1.11) anchors at 1 kHz and steps up and down by powers of 2. The audible range fits into ten bands:
- 31.5 Hz — very low rumble, subwoofer territory
- 63 Hz — transformer hum, HVAC bass
- 125 Hz — low male voice, bass guitar
- 250 Hz — lower midrange, body of male speech
- 500 Hz — midrange, vowel formants
- 1,000 Hz — reference anchor, peak speech sensitivity
- 2,000 Hz — consonant clarity, intelligibility
- 4,000 Hz — the band the ear is most sensitive to
- 8,000 Hz — sibilance, high cymbals
- 16,000 Hz — the upper edge of typical hearing
Ten numbers. That is enough resolution to plot a noise spectrum, overlay an NC curve, or describe the broadband performance of a fan — without drowning the reader in data.
What Is a 1/3-Octave Band?
A 1/3-octave band splits each octave into three sub-bands, each one a factor of 21/3 ≈ 1.26 wider than the last. That gives 31 bands across the audible range — three times the resolution of octave bands for the same frequency span.
The center frequencies follow the ISO 266 “preferred numbers” sequence, anchored on 1,000 Hz. Inside the most acoustically active region (100 Hz to 5,000 Hz), the centers are:
- 100, 125, 160 Hz (within the 125 Hz octave)
- 200, 250, 315 Hz (within the 250 Hz octave)
- 400, 500, 630 Hz (within the 500 Hz octave)
- 800, 1000, 1250 Hz (within the 1 kHz octave)
- 1600, 2000, 2500 Hz (within the 2 kHz octave)
- 3150, 4000, 5000 Hz (within the 4 kHz octave)
The full set extends from 20 Hz to 20 kHz. When you see a rating standard call for a “1/3-octave plot from 125 Hz to 4,000 Hz,” that is 16 bands of test data — the resolution standards like STC and OITC need to distinguish a quiet wall from a noisy one.
Audible range — octave vs 1/3-octave
Same audible range, two different resolutions. Octave bands give a broad overview; 1/3-octave bands give the detail standards like STC and NRC require.
Octave vs 1/3-Octave: Key Differences
- Ratio 2:1 — each band doubles in frequency
- 10 bands cover 20 Hz to 20 kHz
- Centers: 31.5, 63, 125, 250, 500, 1k, 2k, 4k, 8k, 16k Hz
- Used for NC curves, RT60, HVAC cut-sheets
- Fewer numbers, easier to read at a glance
- Ratio 21/3 ≈ 1.26 — three bands per octave
- 31 bands cover 20 Hz to 20 kHz
- Centers follow ISO 266 preferred numbers
- Used for STC, NRC, OITC, ASTM C423
- Required for tonal analysis and ordinance reporting
| Feature | Octave Band (1/1) | 1/3-Octave Band |
|---|---|---|
| Bandwidth ratio | 2:1 (doubling) | 21/3:1 ≈ 1.26 |
| Bands in audible range | 10 | 31 |
| Resolution | Broad overview | Three times finer |
| Reference standard | ISO 266, ANSI S1.11 | ISO 266, ANSI S1.11 |
| Best Use | Plot a noise spectrum, overlay NC, report RT60 | Test wall/floor ratings, identify tonal peaks |
For a deeper reference on band definitions and history, the “Octave band” entry on Wikipedia covers the math, ISO 266 preferred numbers, and the filter standards (IEC 61260) most lab equipment is certified to.
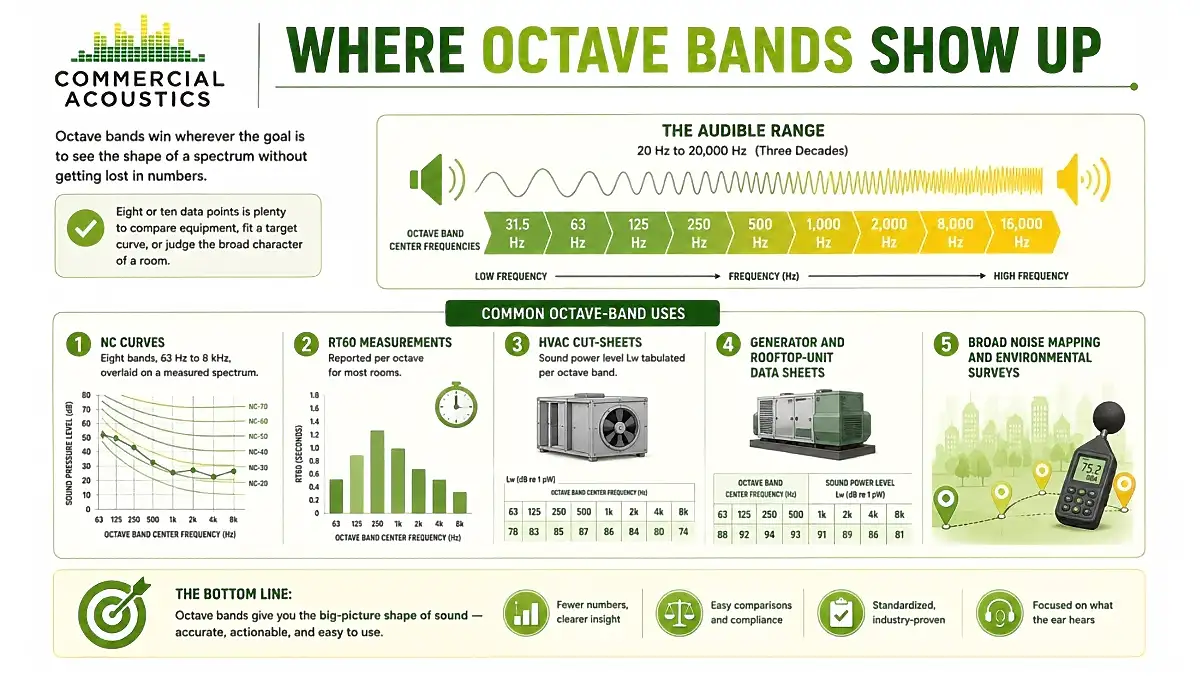
Where Octave Bands Show Up
Octave bands win wherever the goal is to see the shape of a spectrum without getting lost in numbers. Eight or ten data points is plenty to compare two pieces of equipment, fit a target curve, or judge the broad character of a room.
Common octave-band uses:
- NC curves — eight bands, 63 Hz to 8 kHz, overlaid on a measured spectrum
- RT60 measurements — reported per octave for most rooms
- HVAC cut-sheets — sound power level Lw tabulated per octave band
- Generator and rooftop-unit data sheets
- Broad noise mapping and environmental surveys
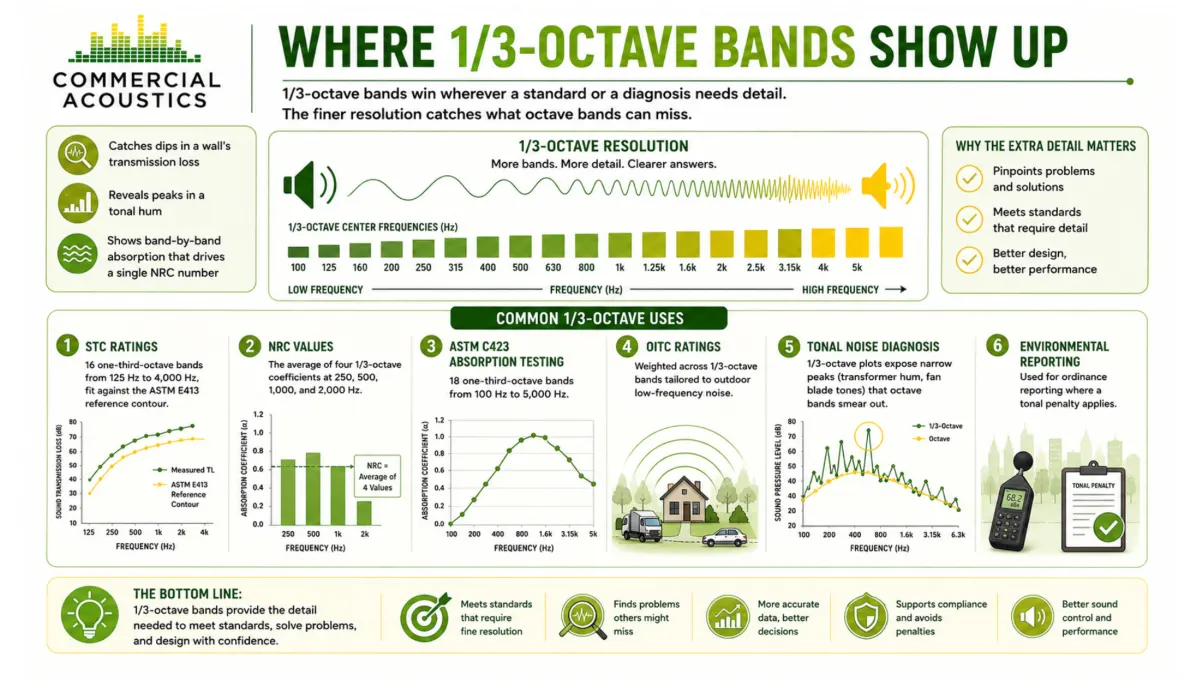
Where 1/3-Octave Bands Show Up
1/3-octave bands win wherever a standard or a diagnosis needs detail. The finer resolution catches dips in a wall’s transmission loss, peaks in a tonal hum, and the band-by-band absorption that drives a single NRC number.
Common 1/3-octave uses:
- STC ratings — 16 one-third-octave bands from 125 Hz to 4,000 Hz, fit against the ASTM E413 reference contour
- NRC values — the average of four 1/3-octave coefficients at 250, 500, 1,000, and 2,000 Hz
- ASTM C423 absorption testing — 18 one-third-octave bands from 100 Hz to 5,000 Hz
- OITC ratings — weighted across 1/3-octave bands tailored to outdoor low-frequency noise
- Tonal noise diagnosis — 1/3-octave plots expose narrow peaks (transformer hum, fan blade tones) that octave bands smear out
- Environmental ordinance reporting where a tonal penalty applies
Real-World Applications
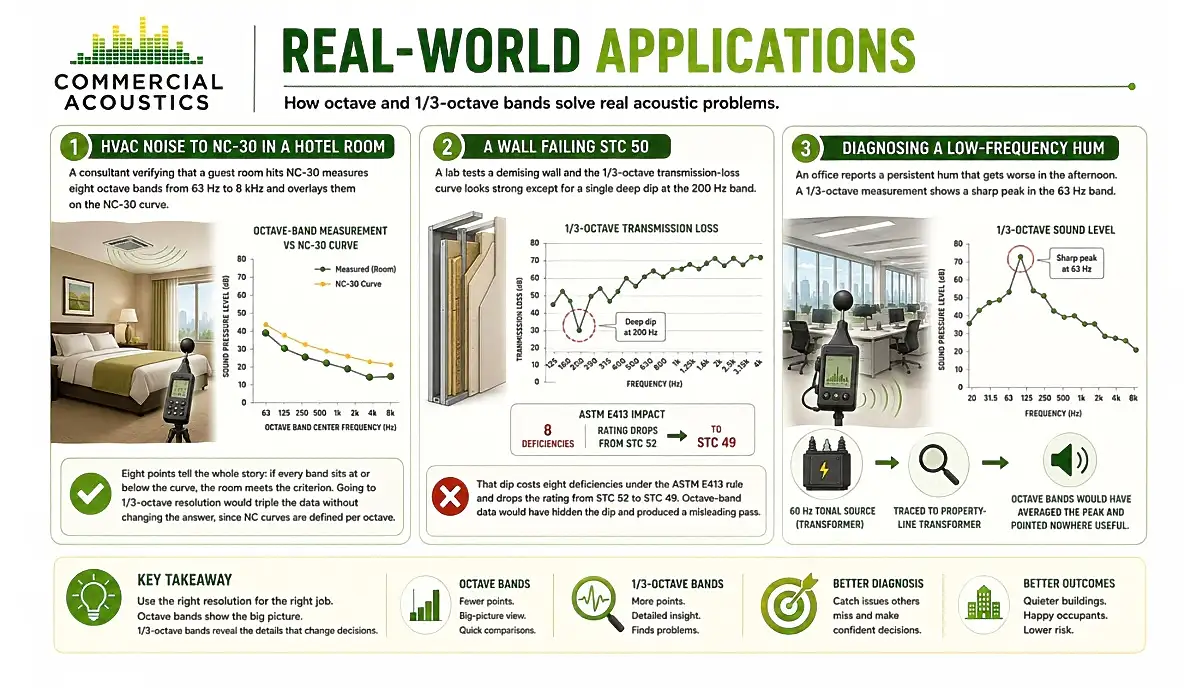
HVAC Noise to NC-30 in a Hotel Room
A consultant verifying that a guest room hits NC-30 measures eight octave bands from 63 Hz to 8 kHz and overlays them on the NC-30 curve. Eight points tell the whole story: if every band sits at or below the curve, the room meets the criterion. Going to 1/3-octave resolution here would triple the data without changing the answer, since NC curves are defined per octave.
A Wall Failing STC 50
A lab tests a demising wall and the 1/3-octave transmission-loss curve looks strong except for a single deep dip at the 200 Hz band. That dip costs eight deficiencies under the ASTM E413 rule and drops the rating from STC 52 to STC 49. The lower resolution of octave-band data would have hidden that dip entirely and produced a misleading pass.
Diagnosing a Low-Frequency Hum
An office reports a persistent hum that gets worse in the afternoon. A 1/3-octave measurement shows a sharp peak in the 63 Hz band, well above the surrounding levels — the signature of a 60 Hz tonal source. Tracing it leads to a property-line transformer; an octave-band measurement would have averaged the peak into the surrounding bands and pointed nowhere useful.
Conclusion: Different Bands for Different Jobs
Octave and 1/3-octave bands describe the same audible range at two different resolutions. Octaves give a broad spectrum readout in ten numbers — clean enough to compare equipment, fit an NC curve, or characterize reverberation. One-third-octaves give the detail standards like STC, NRC, and OITC need to separate a good assembly from a great one, and the resolution a diagnostician needs to pin down a tonal source.
Knowing which band structure a spec or a measurement is calling for is the difference between data that answers the question and data that buries it. Every other number in this field — decibels, ratings, criteria curves — lives inside one of these two band structures.
For expert consulting, field testing, or help interpreting band-level data, contact Commercial Acoustics to connect with our engineering team.
FAQs: Octave Bands and 1/3-Octave Bands
What is the difference between an octave band and a 1/3-octave band?
An octave band covers a 2:1 frequency ratio — the upper limit is twice the lower limit. A 1/3-octave band splits each octave into three sub-bands with a ratio of 2^(1/3) ≈ 1.26. The audible range fits into 10 octave bands or 31 one-third-octave bands.
Why is 1000 Hz the reference center frequency?
1 kHz sits near the center of human speech-intelligibility sensitivity and is the anchor specified in ISO 266 and ANSI S1.11. All other standard center frequencies are computed up and down from 1,000 Hz using powers of 2 (octave) or 2^(1/3) (third-octave).
How many 1/3-octave bands are in the audible range?
31 — from a 20 Hz center at the low end to a 20 kHz center at the high end. Standards like STC use a 16-band subset from 125 Hz to 4,000 Hz, where speech-frequency noise control matters most.
Why do STC and NRC use 1/3-octave bands but NC uses octaves?
STC and NRC are pass/fail rating systems that need finer resolution to detect dips and peaks that change the rating. NC is a target-curve check where eight octave-band readings are enough to confirm a spectrum sits below the criterion. The choice matches the resolution each method needs.
Are octave-band center frequencies the same in ANSI and ISO standards?
Yes. ISO 266 and ANSI S1.11 both anchor on 1,000 Hz and use the same preferred-number sequence, so the standard centers are identical worldwide for both octave and 1/3-octave bands.

Walker Peek|Founder & CEO, Commercial Acoustics
Walker founded Commercial Acoustics in 2013 to bring aerospace-grade engineering discipline to soundproofing, and runs the firm as CEO from its 12,000 sq ft Tampa production facility. The company designs custom acoustic panels, sound membranes, and masking systems for multi-family, hospitality, healthcare, and commercial projects across the US — built around Walker’s invention, Wall Blokker, an EVA-based sound barrier that hits STC 50-plus at roughly $1 per square foot installed.
A Jacksonville native, Walker spent five years at Kennedy Space Center with Craig Technologies before founding Commercial Acoustics — certifying aerospace manufacturing to the AS9100 standard and leading Six Sigma Black Belt process-improvement teams on NASA programs. He is a certified Industrial Noise Control Engineer and the author of Architectural Acoustics: A Practical Handbook.